
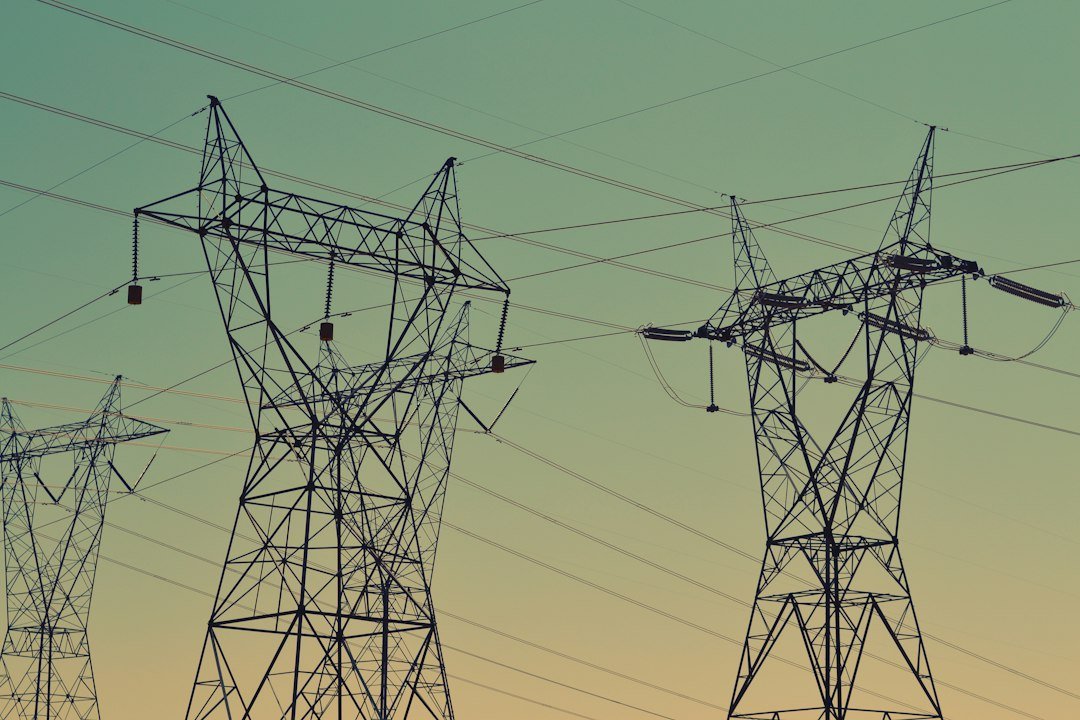
Featured image: Transmission towers illustrate the network carrying electricity to customers. Contextual photograph; not a verified site in the EIA forecast. Photo: Fré Sonneveld / Unsplash. Unsplash licence.
US electricity demand is heading higher, but a national consumption record is only the beginning of the story. It cannot explain which region faces a shortage, what causes a price spike or how much a household will pay.
The EIA’s October 2026 Short-Term Energy Outlook, released on 6 October, forecasts total US electricity consumption of 4,288 billion kilowatt-hours in 2026 and 4,356 billion in 2027, compared with 4,195 billion in 2025. The new figures are projections, not final annual measurements. Read the October outlook, including Table 7a.
Annual energy and peak power answer different questions
A kilowatt-hour measures electricity used over time. A power system also has to supply enough power at a particular moment. An annual total can rise gradually while a local connection faces a much sharper constraint during a busy hour.
Simple arithmetic on the EIA’s rounded totals gives growth of about 2.2% in 2026 and 1.6% in 2027. These are our calculations from the published table. They describe the national change; they do not identify the amount attributable to any individual technology.
That matters for interpreting the AI build-out. A new large customer arrives at a particular substation and on a particular timetable. Its infrastructure requirements cannot be read directly from a country-wide energy total.
The commercial forecast includes more than data centres
The EIA projects 2027 electricity demand growth of 2.8% in the commercial sector, which includes data centres, and 2.7% in industry. Residential consumption is expected to remain mostly unchanged from 2026. Commercial-sector growth should not be labelled an AI-only statistic. The electricity outlook separates the sectors.
The distinction prevents two common errors. Counting an entire sector as AI exaggerates what the data establish. Ignoring large computing loads because they sit inside a broad category understates the planning question. The useful analysis needs both the aggregate forecast and local demand information.
The same outlook estimates that a hot summer raised third-quarter electricity consumption by 4% nationally compared with a year earlier. Cooling needs therefore belong in the explanation alongside longer-term changes in the customer base. EIA’s weather and consumption analysis.
Wholesale prices can move differently across regions
The October outlook forecasts average wholesale electricity prices of US$52 per megawatt-hour across eleven tracked hubs in 2026, then US$49 in 2027. It identifies weather as an important factor and forecasts sharply different regional changes, including higher prices in PJM and lower prices in the Northwest Mid-Columbia region for 2026. Wholesale price forecasts and regional context.
A wholesale price is the cost of electricity in a market transaction. A household bill also recovers generation, transmission, distribution and other service costs. Fuel prices, plant availability, weather and regulation can affect those components differently. EIA explains the factors affecting electricity prices.
As a result, a lower wholesale forecast need not produce an immediate or identical change in every retail bill. Comparing the two requires the same region, time period and cost basis.
The winter outlook illustrates the household distinction
In its separate Winter Fuels Outlook, also published on 6 October, the EIA expects electricity expenditures for homes primarily heating with electricity to rise 4% over the coming winter. It attributes this to higher electricity prices and slightly higher consumption. The outlook supplies warmer and colder weather cases because household expenditure is sensitive to temperature. Read the winter household forecast.
That measure concerns a defined household group and winter season. It is different from total national electricity consumption or the cost of powering an AI campus. Moving between those numbers without their definitions creates an explanation that sounds precise but answers the wrong question.
The EIA completed the main forecast inputs on 1 October. Subsequent developments can change the outlook. Its report explicitly identifies that cutoff, which is another reason to treat the numbers as a dated scenario. Forecast timeline and assumptions.
The signal is growing demand with uneven consequences. Understanding those consequences requires following the electricity from the national forecast to the regional market, the local network and the bill paid by the end customer.
Leave a Reply